ADDITIONS MADE:
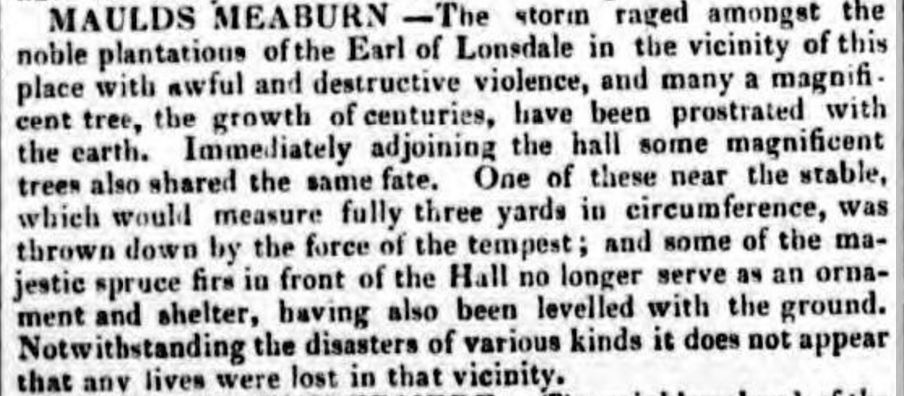
21.06.17. - Maulds Meaburn - newspaper article from January 1839 concerning an 'hurricane' in the village.
11.03.17. - Added the entry from the 'Appleby: Michaelmas, Petition Roll' from 1733 concerning the road to Maulds Meaburn following the floods of that or an earlier year.
20.02.17. - Crosby Ravensworth - now includes the monthly rainfall totals from August 2014 when I set a rain gauge up at the school.
08.05.16. - Maulds Meaburn - Details of floods in 1733 and 1947.
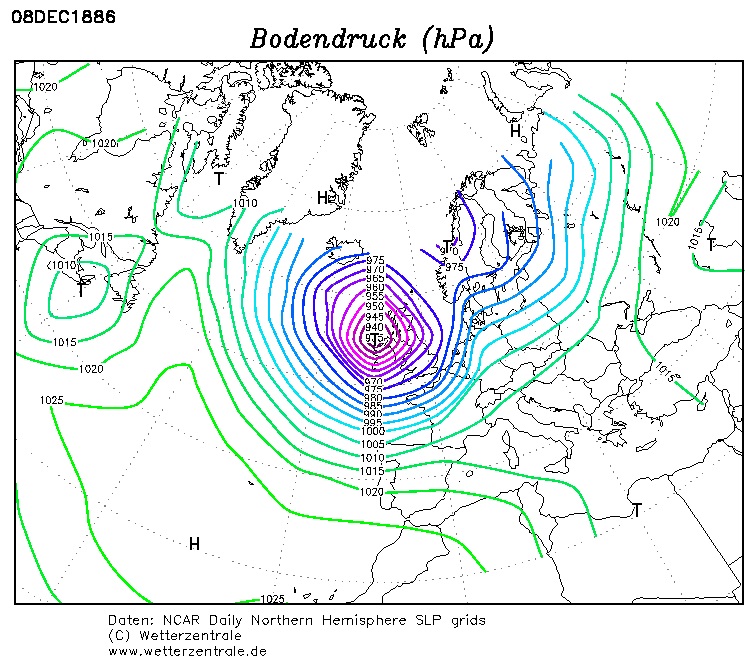
15.01.14. - Reagill - added the synoptic chart for 8th December 1886 to show just how low the air pressure fell that day (and 4.7.14. - barograph reading from Newton Reigny).
08.10.13. - Crosby Ravensworth - Details of the heaviest daily fall in 1874 which at 2.90" (73.7 mm) is to date the wettest day that I have yet discovered in the village.
26.09.13. - 'An Inch of Scotch Mist' - an actual comparison from 1873 between Reagill and others to Seathwaite on days when 1 inch of rain was recorded at Seathwaite.
22.10.12. - Entry and photograph regarding 'Principal Heavy Rains' for 1872-73 for Crosby Ravensworth
02.08.12. - Further additions to Reagill chapter for 1883 and 1887
17.07.12. - Complete re-write of the Reagill chapter - this follows my receipt of the school logbook which has many references to the weather, some of which are quantitative.
20.06.12. - Re Crosby Ravensworth - details of the rain gauge of Reverend Weston and of the year 1875 Re Reagill - April 1875 and in particular the winter of 1878-9.
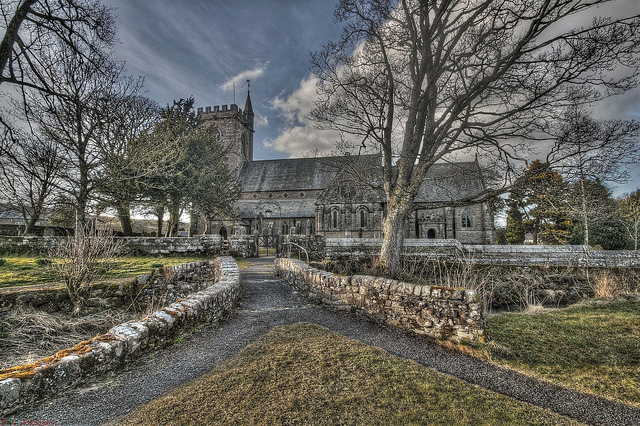
It is an area of great antiquity, with some 90 sites of prehistoric village settlements nearby and is the main village in the parish that also contains Maulds Meaburn and Reagill in rich limestone country and which from 1st August 2016 will fall within the new extension to the Yorkshire Dales National Park.
The weather in the parish can bear little resemblance to that of either Appleby or Shap, but is quite capable of some very decent weather and in the time that I have had a weather station (Maulds Meaburn) we have on occasion been the warmest location in the Northwest region of the UK. The 'Summary' pages on this website has monthly summaries commencing in January 2010 along with some further occasional reports.
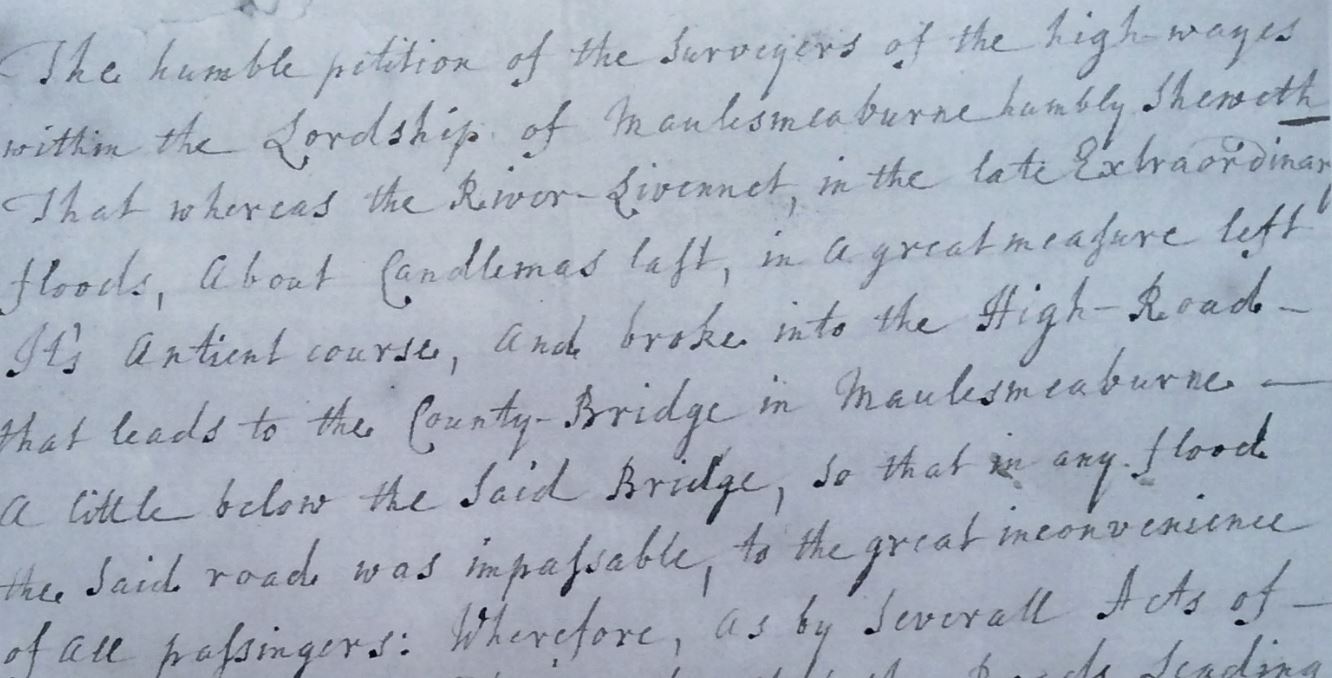
We can not deny though that it does rain, sometimes heavily and sometimes we flood, most recently 2005 and 2015 (Nov' 2009 was terrible, but this part of Cumbria avoided the worst) - the earliest account of flooding that I have found to date is from the 'Appleby: Michaelmas, Petition Roll' (::) dated 1733 (but could posssibly be 1726), concerning the road to Maulds Meaburn, it reads:
'The highways surveyors, William Burra and William Shipherd for Maules Meaburn, desiring county to repair road leading to bridge in Maules Meaburn recently rendered impassable by "the late extraordinary floods" along river Lyvennet.'
Indeed in a report on the counties bridges by the surveyor Thomas Pattinson, dated 5th April 1733, he describes: "Cockermouth Bridge Over [the] Darwent" is much damaged by recent floods; Caldew Wood Bridge is dangerous and "greatly complained of"; Cock Bridge needs repair to its north side; Workington Bridge is "much to be fear'd", as is Warwick Bridge; "Longwathby Bridge ought to be immediately Built; Eden Bridge and Priestbeck Bridge, though lately repaired, need repointing to avert decay, and their paving is "frequently Complain'd on".
(::) Held in the county archives at Kendal, Ref: WQ/SR/41/1 and a section of which is produced below.
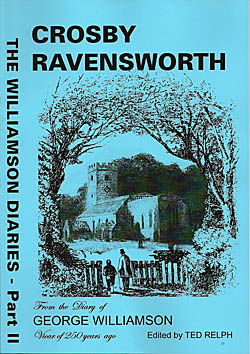
The very earliest information that I have found, apart from that above comes from the diaries of the Reverend George Williamson who was the vicar at Crosby Ravensworth from 1747 - 1783.
These diaries are obviously a vitally important source of information, but alas do not contain 'hard data' such as temperature or rainfall amounts, but Dr. Lance Tufnell of Huddersfield University, who first brought the diaries to the attention of Ted Relph, makes the following observation:
'Despite its limitations, George Williamson's diary is the most important source of data for the study of climate in north west England between 1740 and 1780.
To try and extract all the weather related information from these diaries would be so time consuming as to divert my attention from collating all the hard data that does exist and to which end Tufnell makes the following observations about the weather related entries in these diaries:
'All the weather information recorded...is purely of a descriptive nature, apart from one entry which attempts some measure of quantification and precision (ie. his observation of "snow near a yard deep" on 24th January 1744/5).' Tufnell goes on to explain problems with Williamson's use of the terms 'fair' and 'stormy' and the imprecise way in which they were applied.
One intriguing point that Tufnell does make is regarding Williamson's use of Latin and of old English words that are now largely obsolete. Williamson used 'serenum' (clear, cloudless sky), 'jucundus' (pleasant), 'pluvia' (rain) 'procella' (storm), 'venti' (winds) and 'nix alta' (deep snow), albeit they are only used a handful of times.
The use of old English amounts to: 'lowering' (gloomy, dark threatening), 'clashy' (with heavy and sudden falls of rain), 'blustering' (boisterous blowing of the wind), 'midling' (moderate/tolerable/average sort of day), 'droppy' (rainy, wet) and 'misling' (very fine rain/drizzle) - also most of his entries record just one weather type within a 24 hour period.
The obvious periods to look at though in the diaries are for the harsh winters of 1765-66 and 1779-80 and I repeat these below along with January 1767 which was also very harsh. But Williamson's account of the severe blizzard of 21st February 1762 that caused much loss of life in Cumbria is only described by Williamson as "a sad storm of wind and snow."
1762 - Cold February/March
It appears that the two month's were cold, especially February which had seen snow and frost before that fateful storm of the 21st.
5th and 6th - 'frosty' 7th - 'windy and frosty' 11th - 'a cover of snow... a thick snow in the night' 12th - 'a thick snow' 17th - 'stormy' 20th - 'stormy'
21st - 'A sad storm of wind and snow' 22nd - 'very frosty' 23rd - 'snow and keen frost' 25th - 'frosty' 26th - 'frosty and fine day'
Williamson does not make mention of a thaw, but moving onto into March, the 5th is described as 'frosty and cold' with 'frost and snow' on the 7th. The cold spell continued with the 9th seeing 'A storm of wind and snow', the 10th 'stormy and snowy all day' and the 11th 'keen frost and snow'.
A thaw is finally mentioned on the 12th and the 13th is described as a 'very fine day' and the month continues in a generally 'fine' manner until an entry on the 30th reads 'snow not all gone, more fell but wasted'.
1766 - Cold February
1st - 'Wet and stormy afterwards a flight of snow' 2nd - 'Very stormy' 3rd - 'very frosty and cold.' 4th - 'frosty' 7th - 'Frosty and a cover of snow' 8th - 'Thaw' 10th - 'Wettish p.m.' 11th - 'Very cold'
12th - 'A deep snow' 13th - 'Snow deep, continued laying and very cold' 14th - 'Snow continued laying and very cold' 15th - 'fine thaw' 16th - 'thaw'
2nd - 'Very stormy' 3rd - 'Grandfather weatherbound' 4th - 'very frosty and snowy.' 6th - 'frost' 7th - 'snow by thaw' 8th - 'Very hard frost and stormy' 9th - 'Frost keen'
11th - 'Went to church but none came on account of an uncommon storm of snow' 12th - 'very deep snow' 13th - 'Snow continued' 14th - 'Storm continued, very cold'
15th - 'storm continued' 16th - 'snowy all day, but wind lower' 17th - 'frost and snow continued, now clear' 18th - 'Very hard frost still' 19th - 'no sign of thaw'
21st - 'thaw, froze at night again' 22nd - 'fine thaw' 24th - 'thaw again, fine day, rather frosty' 25th - 'thaw and high flood'
It must have been an interesting month with hard frosts, snow to keep everyone away from church and then the flood - but I'm sure one that the folk could very well have done without.
Winter 1779-80 - Severe cold and death
Whilst not knowing just how cold it really got, the descriptions tell the story and Ted Relph's further research adds poignancy to the harshness and the grim reality of such weather in the 18th century.
December 1779
21st - 'Stormy and frost'. 23rd - 'keen frost' 24th - 'very keen frost' 25th - 'Thank God better of cold' 26th - 'keen frost but no snow'
28th - 'Thaw' 31st - 'frosty'
January 1780
3rd - 'A hazy dark day' 6th - 'fine thaw' 8th - 'frost' 9th - 'very frosty' 11th - 'keen frost and snow at night' 12th - 'Intense frost and very cold'
15th - 'thaw at night' 16th - 'fine thaw, God be thanked'
The thaw continued upto the 18th, with the frost returning from the 19th and whilst a 'keen frost' is mentioned on the 22nd and 'frosty' on the 28th, the diary entries become a little devoid of weather observations.
Ted Relph makes the point that in January of 1780 there was five funerals, three of which were of children - one can only make the assumption that the severe cold was a significant factor in these deaths!!
February 1780 still sees mention of frost on the 2nd with a thaw for the next few days before the 6th is 'snowy' followed by a thaw. But the 11th sees a 'keen frost again' and a few days of frost before a thaw until a 'frost returned, hard' on the 19th. The month ended with some stormy weather and a general thaw although the 27th is described as being 'Very cold day'.
As my time allows I will endeavour to read the diaries and extract from them what I can to add to this page.
1869 onwards - Rev. Weston + Mr. Wilkinson
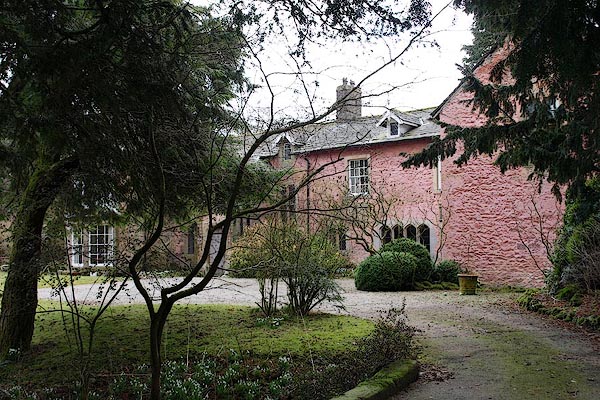
To date the earliest information (hard data) that I have for Crosby Ravensworth is for the period 1869-1878 and comes from the British Rainfall Guides, when the Rev. G.F. Weston employed an 8 inch rain gauge set just 5 inches above the ground, until 1872 when it was changed to the standard height of 12 inches. Whilst I do not know the exact location it is shown as being 600ft above sea level (asl).
Google earth shows that the land around the then Vicarage (now Weston House) was 613ft asl and one must presume that the gauge was set here.
To have 10 years worth of data is quite valuable especially when it can be compared, for 7 years (1872-78), with the rainfall at Reagill and for 10 years (1869-78) with Great Strickland. The comparison of the averages of these three sites is shown in the Great Strickland chapter which is shown below. There is also 2 years worth of data from Morland in this period (see Morland chapter), but as for the reasons mentioned below, I include them for interest and not their value.
However, the Rev. Weston had his rain gauge set far too low for those first couple of years, but interestingly the year (1872) when he corrected it to the proper height he recorded his highest annual rainfall! The standard was to become a 5" gauge set at 1ft above the ground as it was found that gauges set too low over recorded as during spells of heavy rain it would 'splash back' into the gauge. Certainly when compared to the figures at Reagill, those of the Reverend are that bit higher, but consistently so. I do not know if Weston House was surrounded by high trees during the Reverend's time as it is now, I suspect not with such readings and it might be that the gauge at Reagill (or the village itself) is that bit more sheltered.
Rev. Weston actually commenced his observations during 1868, the Rainfall guides makes the (unusual) comment in this edition by way of introduction that, his addition to the reporting of rainfall was most welcome. It goes on to add 'It is about half way between Wet Sleddale and Appleby and the returns of the six months it has been at work afford a most satisfactory corroboration of the high values reported from Wet Sleddale...... we welcome the returns as from a most important out-post.'
To make a direct comparison between Crosby Ravensworth and Wet Sleddale is in my mind somewhat misleading as the two locations, whilst relatively close in distance, are otherwise dissimilar.
The details are:
As with a lot of the data from other sites to be shown below, a lot can be traced to either the county archives or to the Met' Offices own library archive, but to date I have not yet discovered the Reverend's records.
The Principal Heavy rains of 1872-74.
For the period 1865-67 the Rainfall Guides listed the maximum fall for a 24 hour period for all of the reporting stations, but from 1868 this became the 'Principal Heavy Rains' of the year and a stations wettest day was only generally includeded if it met the criteria of having being over 2 inches or more than 5 % of the total annual fall. In the 1873 edition we find the following entry for the 18th January and what was a wet day for Crosby Ravensworth and Reagill - Crosby Ravensworth even had its own special mention for a slightly interesting coincdence for these two years.
So for 1872-74 the wettest days in these years were:
1872 - 2.20" (55.9 mm) - 17th January (=3.25% of the annual total)
1873 - 2.20" (55.9 mm) - 18th January (=5.4% of the annual total)
1874 - 2.90" (73.7 mm) - 2nd April (=4.0% of the annual total) - *see below along with the Reagill chapter.
* - I find this detail rather curious for several reasons.
Firstly, this 2.9" of rain is the wettest single day that I have yet found within the entire records for the village and indeed until December 2015 (Storm Desmond) was 5.7 mm more than the wettest day that I had recorded (since 2007). But in the Rainfall Guide it is simply annotated 'The maximum at a few detached stations.' and no great emphasis is placed on this day at all.
Secondly the observer at Shap, who did submit various notes regarding particular days during the year, made no reference to 2nd April, but as for October 6th that same year it was a different story.
6th October was described as 'The most important rain which occurred during the year... probably with no equal since July 6th 1872.' - and this was the wettest single day in the entire 18 year record at Reagill (see also '1874' in the Reagill chapter), but it wasn't even the wettest day at Crosby Ravensworth during that year!
The observer at Shap (3.70" inch that day) makes the following comment regarding the 6th October "High winds and great fall of rain this day (3.70") and as 1.05" fell yesterday, there are great floods, much land is under water and some roads are flooded."
Unfortunately as the Rainfall Guides only listed the maximum falls in a year at any one site and this occurred in April for Crosby Ravensworth, the guide doesn't show the fall at Crosby Ravensworth for 6th October - but whilst I can see it as been between 2.50" and 2.89" that day, it does seem to be slightly odd that the April date was the wetter of the two.
The British Rainfall Guides contained sections for the observers to make comment on the following: notes on principal phenomena, notes on the months and notes on the year. In the years that the Reverend submitted his data he made very few comments, but below is the one that he did make:
1875 - 'Less Rain Than Usual'
Less rain than usual (46.81), no inconvenience from floods.'
What I find slightly bizarre about this is that 1875 was one of the drier years in the period and the Reverend feels inclined to make a comment, but he makes no comment whatsoever about the very wet years of 1872 and 1877!!
For the period 1872 - 1889 (18 years) Mr. Wilkinson was the school master at Reagill and he was making weather related observations during this time; in particular rainfall records. He provides us with a rich source of information both via his contributions to the British Rainfall Guides and especially via his entries in the school logbook. This logbook provides a fascinating account of the weather of the time and in particular its effect on everyday life.
As with the diaries of the Rev. Williamson, Wilkinson's logbook entries provide us with tantalising snippets of hard data and this logbook, along with the few submissions that he sent to the Rainfall Guides, confirms for me that he did keep and maintain a meteorological register. In many ways it is Wilkinson's records that are the most frustrating for myself, because - what became of them?
From the logbook we know that he kept a rain gauge, Min'/Max' thermometer and barometer and he clearly kept daily, monthly and annual records from these. But references to hard data from his records in the school logbook are limited, but one entry in particular as proved very valuable to myself.
In short, the rainfall record for 1880 was absent, it did not appear in the rainfall guides and also enquiries with the Met' Office showed that they also were missing this year. But in 1889 Wilkinson makes an entry in the logbook that conveniently includes the mean rainfall for the years 1872-1888 and from which I was able to calculate the rainfall for 1880.
So what we do have is an 18 year record of rainfall, which, is most important and of great value, especially taken with the other sites locally at that time.
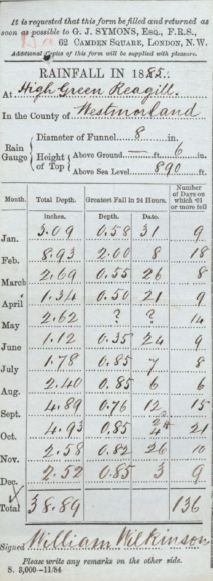
Wilkinson's rainfall records are stored in the Met' Offices archive, shown as published 1885, Ref: Archive Y12.D1-D3. I have the yearly card submitted by Wilkinson in 1885 to the Rainfall organisation, kindly provided by the Met' Office library archive and give its details below.
Initially Wilkinson employed a 6" diameter rain gauge set at 6" above the ground, at the given location of 'High Green'. The rain gauge was then changed in 1874 to an 8" gauge set at 1ft above the ground and was then changed again in 1881 to 6" above the ground. I have visions of him tearing his hair out as each year passed by with him unable to explain why his gauge was recording less than that of the Reverend Weston. How and where it is positioned is clearly quite crucial. The annual amounts for those years are shown below.
As already mentioned, Wilkinson also had a Min'/Max' thermometer and there are references to temperatures in both the school logbook and also in some of the submssions that he made to the Rainfall Guides - (see 'Warm in April 1875' and 'Winter 1878-79, long and severe' below). Another example of the fact that he must have kept records is shown in the comment for 1879 'on only nine days in the year attaining 70°f' - what became of those records? Oh if only I could find them.
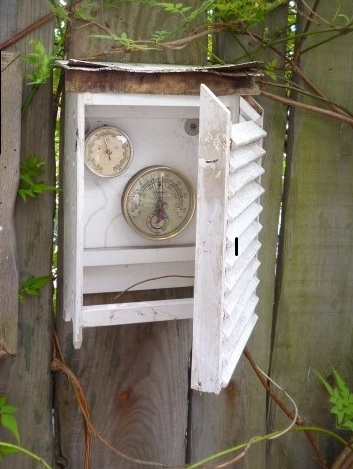
For what it is worth, I would suspect that the thermometer was hung on a north facing wall and not necessarily housed in a screen, (the photo' below gives some idea of what was typical of the time) - but if it also amounted to 18 years worth of records it would be the best find of all.
One curiosity of note is that not all the submissions that appear in the Rainfall Guides are referred to in the school logbook. The stormy year of 1886 does, but those for April 1875 and winter 78-79 don't.
A typical and recurring entry in the school logbook is thus, taken from 1874 'Dec 11 - Snowstorm - 11 children absent' although the entries do become more detailed in later years.
The following are a selection of entries from the school logbook:
1874 - A Snowy December and the Wettest day in the 18 year record*
Dec 11 'Snowstorm - 11 children absent' Dec 14 'Thick snow - 8 children absent' Dec 18 'Bad attendance this week � snow thick on the ground � in places drifted' Dec 24 'Bad attendance � Thick snow - The weather being very stormy the children wished to have only one week holiday this Xmas and to have the remainder of the holiday in the Spring when the weather is fine'
What is slightly strange about 1874 is that it had one extremely wet day, Oct 6th when 2.78 inches of rain fell, but Wilkinson makes no reference to it. That is 70.6 mm and very wet and would beat my own record of 68.0 mm - for some reason we have to wait until an entry on 29th October 1888 to know about this day!
* Also see Crosby Ravensworth above 'The Principal heavy Rains of 1872-74' - and it all seems even more strange!
The entries for the next few years focus on wet days with only 'Sept 3 - Very wet morning. 1.32 inches rainfall' from 1875 offering anything quantitative. Indeed there were only four of five entries per year offering a simple 'Very wet' and the next entry of interest is 'Tues Feb 27 - Heavy fall of snow � four children absent' from 1877.
But already we see that a submission made to the Rainfall Guides did not warrant an entry in the logbook, it is thus:
1875 - 'Warm In April'
20th - '74°f in the shade.' - The observer for Shap also commented on this day, stating 'Very hot, with distant thunder.'
74° is 23.3°c and is just warmer than my highest April temperature of 23.1°c in 2011.
But April can be changeable and only the very next day on the 21st the Shap observer commented thus, 'Bitter cold east wind.' and then on the 29th it was 'Hot, with distant thunder.' Very mixed up weather indeed.
1878 - 'A perfect Summer'
In this year just one brief entry from the Rainfall Guides for the year as a whole - sounds like a perfect and long summer 'Cold backward spring. Remarkably fine dry summer and autumn until October 24th'
But in the submissions regarding particular days he noted the following about the 21st May:'Pennine range and High Street white with snow.'
Winter 1878-79 - 'Long and Severe' and other comments on 1879
The logbook is slightly bereft of detail and the main body of information comes from the Rainfall Guides, but the logbook entries from November 1878 give a suggestion of winter having started early:
Fri 1 Nov 'Cold prevalent this week - 4 children absent' Fri 8 Nov 'Heavy fall of snow - 6 children absent' Tues 12 Nov 'heavy fall of snow - 4 children absent' Mon Dec 30 'Commenced again (school) - the weather stormy'
There is only the one logbook entry in 1879 for the 1878-79 winter:
Fri Jan 20 'Heavy fall of snow on Saturday last which as remained on the ground'
So it is from the Rainfall Guides where we get the most information and whilst Wilkinson does not make any comments regarding particular days, his comments on the year (1879) as a whole paint a cold picture.
'The winter of 1878-9 was very long and severe; numbers of small birds perished. Cold summer; on the 2nd of June the mountains were thickly covered with snow. Autumn fine; on only nine days during the year was the temperature 70° or higher, the max' being 75°.'
To try and put some context on how cold the winter of 1878-9 was comments from other Cumbrian sites are: Blencowe school - January was extremely cold with a mean temp' of -2.7°c (27.1°f) and the mean temp for winter at Elterwater is quoted as 30.6°f (-0.8°c) which is quite remarkable and would probably explain why in March 1879 Ullswater is described as being frozen over for its whole length for 14 weeks and skating was taking place on Derwent water.
To have only nine days attain 70°f (21.1°c) is a very low number indeed, I would be expecting somewhere in the region of 25 days to get that high.
Another general theme from the logbook (and indeed a common one from all observers in the Rainfall Guides) is the effect that poor summer weather had on haytime, but again these are not quantitative - we have to wait until 1883 before the logbook provides something of interest and this entry is substantial!
Wed 12 Dec 1883 'Since the seventh of January One thousand eight hundred and thirty nine, (7th January 1839)+ such a terrific and disastrous storm of wind and rain, and in some places lightning and thunder, has not been known in this part of the country, as that of last night. Hundreds of trees in Pitt Hills, Hardbank and other neighbouring Woods, and all over the country, torn up by the roots, many broken at various heights up the stems. Great damage done to buildings, corn and hay stacks etc. Several of the dwelling houses in this village (Reagill) shaken by the force of the wind, much the same way as they were by the second slight shock of earthquake on the night of the seventeenth of March, One thousand eight hundred and seventy one' (1871). ! 'Nine children absent from School on account of the storm this morning'
+ The storm of 7th January 1839 caused much loss of life, especially at sea with several ships lost.
! The earthquake mentioned is credited to Appleby and is estimated as measuring 4.9 on the Richter scale.
For some reason Wilkinson wrote out the dates/years in full which is slightly odd and alas he did not submit any comments regarding this storm to the Rainfall Guides, but others did, the nearest being from Shap (Copy Hill):
'A dreadful storm of wind from west on the night of 11th and morning of 12th, causing great destruction to houses, walls and trees'.
Clearly it was a storm to remember and one which he could equate to past events and originally I thought it curious how he could personally do so back to 1839, but then in the Rainfall Guides the observer for Blencowe school states:
'A fearful storm of rain, hail, thunder, lightening and wind passed over.... no such wind experienced since 1839!'
You wait 44 years for such a storm and then two come along in no time as the following entry from 1884 shows:
Thur 21 Feb 'Another terrific gale last night, nearly as severe as the previous ones, see Dec 12, Jan 25 7 26'
But like the other years that it refers to, it does not go into anywhere like the detail as that of 1883.
1885
Whilst we have no entries for this year, what we do have is the card completed by Wilkinson and submitted to Symons's Rainfall guides showing his yearly returns.
1886 - 'Stormy Year'
1886 was clearly a bad year with a cold and stormy winter and generally unsettled throughout. The entry in the Rainfall Guides is actually less informative than the logbook, but both paint a bleak picture; first the entry in the Rainfall Guides:
'The oldest people here say they have never known so stormy a year nor one so bad for farming. In the early part there were several heavy falls of snow, with rapid thaws for a time, then sudden change to hard frost
The time for both hay and corn harvest was very wet; the corn crops were much damaged and were not secured until late in October - a considerable part not till late in November.'
Mr. W. Hoggarth was the observer for Copy Hill in Shap and he did submit more substantial reports, extracts from his reports for January and February read:
JANUARY - 'Remarkably changeable. Heavy showers of rain then hard frost....then heavy falls of snow which drifted in many places. The latter part of the month was one continual fall of snow which lay at the close to a very great depth; walls were not to be seen...roads and railway hard to keep open; many small birds died.'
FEBRUARY - 'Very seasonable. Most of the January snow was still lying, at the close of this month, in heavy drifts behind the walls and in narrow lanes, some of which were quite full. Keen frost prevailed and farm work was at a standstill.'
Moving onto the school logbook:
Fri Jan 16th 'Since the 4th inst, the weather has often been stormy and very changeable, heavy falls of snow, rapid thaws for a short time, then sudden change to sharp frost'
Fri Jan 22nd 'Poor attendance this week owing to the continuance of the stormy weather'
Fri Jan 29th 'Twelve children absent this week through the heavy falls of snow'
Mon Feb 1st 'Heavy fall of snow again yesterday'
Fri Feb 12th Since Monday this week we have had slow quiet thaw after five weeks of snow storms, rapid thaws suddenly changing to hard frost.
The highways in many places have several times been blocked up with deep snow, at other times one sheet of ice, and for a great part of the time many of the children unable to get to school.
Mr Christopher Airey of CastleHowe Scar now upwards of eighty five years of age and who has never lived at any place but Hardendale and Castlehowe Scar, says he has never known so long and bad a storm. We have a similar statement by another old man who has lived upwards of fifty years in this Township.
In recording this unusual stormy time, it may be mentioned that the rainfall for the last year, (1885) was thirty eight inches (decimals omitted) being six inches below the average of the thirteen previous years. For the month of Jan (last month) the mean day temperature was thirty six degrees and mean night temperature twenty six degrees. Monthly range of temperature thirty five degrees'
Tues March 2nd 'Yesterday had another very bad snowstorm, as bad as any we have had this very stormy winter. Men who had come from Shap about 4p.m. said it would not be safe for the children who came from Castlehowe Scar and Hardendale to go home, the driven snow being so blinding and the cold so benumbing, Five boys remained in the School until a man whom we sent for came from Castlehowe Scar for them. Three girls stayed all night at our house. This morning only one boy had arrived from Hardendale. He says the girls will not be able to go home this evening the roads are so blocked up'
Wed April 7th 'Today a great storm of very strong wind and heavy rain came on'
Thurs May 13th A cold stormy like morning. Eleven children absent. Yesterday snow fell heavily all the afternoon. Supposed six or eight inches fell, a most extraordinary change of weather in the last few days. On Thurs last the sixth inst. The temperature in shade was seventy five degrees and the following day seventy. Today forty five'
Thurs Dec 9th 'Yesterday and today very stormy, strong wind, snow & rain. Fifteen children absent through weather & sickness. The barometer last evening the lowest (about nine p.m.) ever known, twenty seven and one tenth inches'
Just to try and put some context on these entries is awkward. The temperatures quoted for January (see Feb' 12th entry) would make for a mean temperature for the month of -0.5°c (31.0°f) - this is cold, but certainly not unique (we had -2.0°c in December 2010). It would just be nice to know the other monthly mean temperatures for this winter.
The entry for May 13th is staggering, 6-8 inches of snow in the middle of May is hard to grasp, especially when so much as fallen at low level and this followed on from what was a warm start to the month, 75°f is warm on any day.
The final entry from December gives a barometer reading of 27.1 inches, this being an amazing 918 Mb. I have a great difficulty with this, the UK record is 925.6 Mb set in 1884, but Wilkinson does state that it was 'the lowest ever known'.
But I have now found the synoptic chart for that day and also details from a meteorological register taken at Newton Reigny (Penrith) and whilst I still think that the pressure noted by Wilkinson is too low, there is some credence in his 'claim'.
The lowest (adjusted) pressure recorded at Newton Reigny was 27.556 inches (933.4 Mb) and this was using a barograph - Wilkinson was close with his reading and it was possibly just that his reading was not corrected to 32°f and sea level.
1887 - Driest and Hottest Summer with severe drought - but Very Topsy Turvey
January was generally a 'stormy' month and then we have:
Mon Jan 17th For two or three days the barometer has fallen, and considerably this forenoon with a strong, bitter cold south east wind. About midday the sky darkened and seemed to portend an immediate & great snow storm. At one o�clock snow began to fall and the wind to blow stronger. Four boys and one girl from Hardendale and two boys from Oddendale were allowed to go home and urged to make the best of their way. The fall of snow kept increasing and about an hour after the boys & girl left we had such a blinding snow storm as we have seldom seen.
Tues Jan 18th This morning the surveyor of Highway for Reagill has had to send men to open half a mile of road, now blocked with snow viz. the whole distance from Scar Guide Post to the Boundary Post bottom of Harkeld. Mr Christopher Airey of Castle How Scar told the men he had never seen so bad a storm. He is eighty six years of age and has lived at or near his present residence all his life.
Wed Jan 19th Strong wind heavy rain only eight children present.
Wed Feb 2nd Today twenty children present, this afternoon so very stormy strong wind, rain and snow that the three little girls from Hardendale are to stay at our house all night.
And whilst the start of February was stormy things obviously improved.
Mon Feb 28th This upon the whole has been a remarkably fine month, Snow, one light fall only, Rainfall two and three fourths inches.
But then in May yet another remarkable and late fall of snow and a minimum temperature of -2.8°c!
Fri May 20th Sixteen children absent through weather, a very stormy morning � snow fell heavily from seven a.m. until midday � very thick on Pennines and West Fells. Last night the thermometer registered twenty seven degrees.
Sat May 21st Fall of snow again this morning. The ground white here. � The East Cumberland News of Friday May 20 1887, in a paragraph on the Storm says �There was a very heavy fall of snow in the Penrith district this morning. The mountains are covered with snow and it is feared there will be serious losses among sheep.�
But how quickly things can change and soon hot weather and drought were the order of the day. A temperature of 83°f is 28.3°c, a very warm day.
Fri June 17th Nothing particular to mention this week except that we are having excessive hot weather and drought. Yesterday the temperature registered in shade was eighty three degrees and last night fifty three degrees.
But then an equally remarkable entry comes in October and now I wish I had the monthly rainfall totals as well as the annual totals.
Thu Oct 27th 'Strong, cold south east wind and rain. Very likely to be a stormy day, and the end of a long and great drought. The scarcity of water has been much felt in the village and the neighbourhood for months. At the present time some of our neighbours are having to cart from a distance.'
We also have an entry from the Rainfall Guides this year and it relates to that long, hot summer:
'Supposed to have been the driest and hottest summer since 1826. The total rain of May, June, July and August was only 5.64 inches. The hay and corn crops were the lightest ever known. Temp. above 80°f on six days.'
1887 was the driest year in the 18 year period, but it wasn't excessively dry (compare our 702.9 mm in 2010), but it was a dry 4 months, Appleby reported that no rain fell between June 6th and July 3rd and at Orton and even Longsleddale, all the springs were described as being dried up. Warm as well with those days over 80°f (writing this in summer 2012 we can't even manage one!).
1888 - Simply Remarkable
The year seems to have started quietly and the first entry is of some snow in February.
Mon Feb 13th 'Snow has fallen at times since Friday evening, snow is now three or four inches deep & is still falling this morning'
Tues Feb 14th 'Snow fell this morning'
There is no comment on the on-going weather, which the next entry in March would suggest was quite bad.
Thu Mar 15th 'attendance had been bad for several weeks owing to the severe stormy weather. The following is taken from the newspaper the Liverpool Echo of Wednesday March 14 1888 - "On the Westmorland hills the most bitter and furious hurricane ever remembered has prevailed since last night."
Fri March 23rd 'The early part of this week bitter cold'
We then have entries in July that are simply remarkable and in a logbook full of amazing snippets, these are probably the most amazing and as far as I am aware, unique.
Wed July 11th 'The weather unusually cold for the time of the year. We have had to light a fire in the School room for several days lately. Yesterday the registered temperature in shade was fifty five degrees and the registered for last night twenty eight degrees'
Fri July 13th 'The following is copied from a newspaper the Liverpool Echo Wed July 11, 1888 - �Winter in the Lake District.�
�Snow fell in the higher mountains of Cumberland and Westmorland last night , and the peak of Skiddaw was white this morning. Such an occurrence cannot be remembered as having occurred before at this season. There was, however, a heavy hailstorm on the 20 July 1878 following a week of excessive heat. The temperature at Keswick today is fifty degrees.�
And then when we get to October and the very start of the month is just as remarkable.
Tues Oct 2nd 'Yesterday snow fell, at times heavily, from six a.m. until eleven a.m. and last night sixteen degrees of frost was registered'
Fri Oct 5th 'Yesterday, great snow storm all the afternoon. The Pennine mountains covered thick, and the country between them and here white for many hours.
Last month, very fine and at times very hot weather. This the first week in October we are having severe winter weather. The mean registered temperature of the last four nights, twenty degrees'
Mon October 8th 'The weather became much milder yesterday evening, after a week of the most severe weather for the time of year ever remembered'
Once again trying to put this into context is difficult, this isn't a one day event but lasts for at least four. It isn't just snow on the mountain tops, but it is also down to village level, which so early in the season is rare - but once again those temperatures!
16 degrees of frost is 16°f (-8.9°c) and on the 2nd of October; some winters don't get that cold! Then the 20°f (-6.7°c) average for four nights - crazy.
It was obviously a time of little rainfall because at the end of October we learn:
Fri Oct 26th 'Very strong wind and rain. The end of a great scarcity of water'
Mon Oct 29th 'Since the week of severe winter weather, (the first week of the month) the weather has been remarkably fine for the late harvest and most of the corn crops have been secured in good condition. A great change came on Thursday evening last & from then until yesterday evening, (Sunday) a little over five inches of rain fell.- During the twenty four hours ending 10a.m. yesterday 2.36inches fell. The heaviest fall in 24 hours for the last eighteen years with one exception, viz. Oct 6th 1874 when 2.78 inches fell'
The Observer at Shap (Copy Hill) in the Rainfall Guides describes the 5th-23rd as being 'quite summerlike and at times very hot; water scarce in some places'. But again strange that Wilkinson now refers to his wettest day on record (from 1874), but didn't mention it at the time!
We then move onto November and a slight curiosity in that he refers to a gale during the month as being the worst since the one in 1884 - why not the one in 1883?
Fri Nov 16th 'Today the greatest gale, (strongest wind) since 20th Feb 1884 � Several stormy days this week'
I have a real frustration with Wilkinson for this year, because so much happened and yet he didn't submit a report to the Rainfall Guides. But then when I read the rainfall Guides there are precious few entries that refer to the above entries, albeit they are corroborated.
1889 - A Quieter Year and some warm days
It looks like May and June were good months with plenty of fine weather
Fri May 24th 'The only thing worthy of recording is that during this month we have had remarkably fine hot weather. The oldest people never knew the month of May so fine and so much grass in the fields. The mean temperature in shade for the last seven days being seventy three degrees, and the mean temperature for the last seven nights forty eight degrees.
Fri June 28th 'Owing to the remarkably fine, hot weather since the beginning of May the hay harvest is the earliest ever remembered. Nearly all the neighbouring farmers commenced cutting the grass on or before this week.
On about thirty of the days since the fourth of May to this date, the thermometer, in shade, registered seventy degrees and upwards, the highest being seventy nine degrees.
The total rainfall since the first of May has been less than three and a half inches, and the total for this year to the present time, not quite eleven and a half inches. Rain much needed.
The annual average rainfall for the seventeen years ending Dec 31st last is 42.67 inches. The greatest rainfall was in the year 1872 when 61.81.inches fell, and the least fall in the year 1887 when 29.38 inches fell. Last year (1888) the fall was light being only 37.81 inches. So far this is the third year in succession in which the rainfall is light.
Fri Sept 6th (See entry June 28) 'On July the sixth rain fell, which was much needed, and the weather became very showery for several weeks. The hay much damaged by the rain. Since Aug 27 the weather has been very fine and several of the neighbouring farmers (but not all) have this week secured the last of their hay crop. Many busy with the corn harvest, which this year is early and crops good.'
This is the entry from June 28th that very obligingly assisted me with calculating the missing year (1880) of rainfall data.
The summer sounds idyllic, warm, fine and dry days (that total of 30 days being 70°f and above is amazingly high for the end of June), if only all summers were like that - isn't it the case that all our childhood summers were that good and that it is only the summers of adulthood that are cold and wet?
But they didn't get the rain that was needed because 1889 became the second driest year in the 18 year record and whilst 1889 was the last year in which Wilkinson was recording, 1890 was also a dry year.
W Wilkinson retired as the school master on April 29th 1890; his successor was a W. Lee and whom, it would appear, did not continue the rainfall records. Indeed the 1890 edition of the Rainfall Guides shows the Reagill records as 'ceased'!
The annual rainfall totals are given below with additional comments/observations following on:
However, it would appear that Mr. Wilkinson was possibly a little bit lax in his daily recordings as the number of days on which he records rain as having fallen, would appear to be very low. Possibly with being the school master he did not always check on a Sunday?
It was a common theme in those days and one that caused Symons much consternation, that the observers did not always check their rain gauges daily. The monthly/yearly rainfall total would not be affected but the number of days on which rainfall was recorded, was. Just 0.01 inch (0.2 mm) is enough to be recorded as a 'Rain day'.
A few comparisons with other nearby sites demonstrates the point:
1885 saw 25.28 inch of rainfall on 175 days in Appleby and on 198 days in Shap - Reagill was 38.89 inch on just 136 days
1886 saw 42.90 inch of rainfall on 190 days in Appleby and on 226 days in Shap - Reagill was 48.69 inch on just 169 days
And it seems that Wilkinson moved a long way, to ... Church View in Shap. The possible reason for his resignation from the school (7th May 1890 at the age of 69) was the fact that the logbook records that his wife, Rebecca, (who helped him in school and was much younger, aged 45 in 1890, died 1896) had been unwell for many months. But curiously Wilkinson took his rain gauge with him and he made observations for 1894 and 1896-1898 before his own death in 1903.
An Inch of Scotch Mist
From the 1873 edition of British Rainfall we find a curious report entitled 'Scotch Mist', which examines 'some peculiarities in the rainfall of hilly districts as compared with that experienced at ordinary stations.'
Effectively the report concerns days on which one inch or more of rain fell at Seathwaite in Borrowdale and compares it to the rainfall totals at Durham, Greta Bridge and, much to my surprise, Reagill.
The reports author is the Rev. F.W. Stow. M.A., F.M.S., who was the then vicar at Aysgarth in N.Yorks and as yet I am unaware of any link between him and Wilkinson.
But with this report there is genuine interest, peculiarities and frustration, the biggest peculiarity being, why Reagill?
Stow does not say, other than 'It occurred to me that it might be of advantage to examine the falls exceeding an inch at Seathwaite, setting them side by side with the amounts registered on the same day at more easterly stations ...' - how exactly that constitutes an examination of 'Scotch Mist' I do not know, but there in direct comparison are the falls of Seathwaite and Reagill!
And to that end he produces tables for 1872 and 1873 listing all the days on which one inch of rain fell at Seathwaite during the two years along with the daily fall at the three other sites.
Also as part of his report he compares the rainfall of Seathwaite and Reagill on the days that Durham and Greta Bridge recorded one third (0.33") of an inch of rain and again lists the daily totals.
How did Stow obtain the Reagill data? Did he know Wilkinson? I never doubted the fact that Wilkinson kept a daily meteorological register of some kind and this is only further evidence of such, but here as early as 1873 it is being put to scientific use.
What is frustrating is that Stow makes no acknowledgement of the sources of his data and as for Reagill does not make any mention of it at all in his report other than to explain where Reagill is.
Stow's report considers the effect of temperature, wind direction, mountain topography and the various climatic causes of rain to try and explain the differences, but fails to mention that somewhat important matter of the northern Pennines that separates the locations and acts as a natural block to weather systems moving west-east and vice versa.
However, below I re-produce the tables as compiled by Stow, those marked with an * are for the days that he marks as those with 0.33" of rain at Durham and/or Greta Bridge.
But to see Reagill directly compared to the main iconic rainfall site in the UK (it was the most iconic 1873 and still is today) did take me totally by surprise.
Just one quick aside to this and how and why Stow chose Reagill to use in his comparison and how he managed to get hold of Reagill's daily rainfall records, I have failed to find a link between Wilkinson and Stow, but two coincidences have emerged:
1.) Revd George Weston�s brother, Revd Thomas Woods Weston, was vicar of Tunbridge Wells 1858-91 and Revd Stow was curate there 1867-69 - Perhaps George met Stow on a visit and continued a friendship when Stow moved north to Aysgarth and from this he got to meet and know Wilkinson. Although there is no evidence for this - thanks to David Risk for this research.
2.) Stow had also used Durham and Greta Bridge in his comparisons and again why these sites? Now it may only be a coincidence but, at Greta Bridge we have a Miss Dodgson but at Durham a J.J. Plummer esq is listed.
The coincidence with Plummer being that the observer at Great Strickland at the same time was H. Plummer esq � I just wonder, but then why not just use the Great Strickland data?
And unfortunately at present that is were the trail goes cold for some considerable time....until 1945.
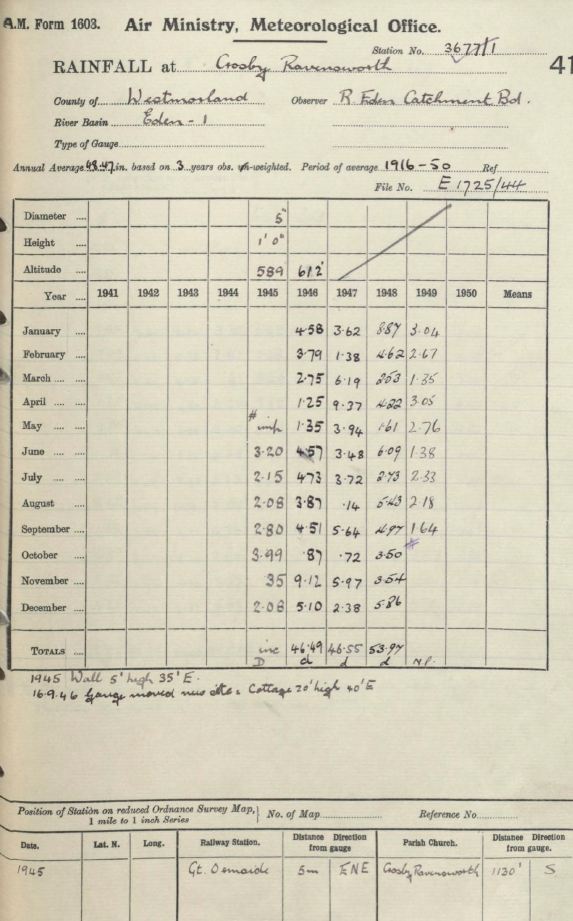
The 'River Eden Catchment Board' employed a 5" gauge at 1ft above the ground at and whilst I do not know the exact location of the site the record sheet is annotated '1945 wall 5' high 35' E' and the gauge is shown at 589 asl. In 1946 the gauge is moved to 612 asl and the notes state '16.9.46. gauge moved new site, cottage 20' high 40' E'. Also the records show that the gauge was 1130' (Ft) to the north of the parish church.
This site, for which the rainfall records cover the period June 1945 to September 1949, was an official Met' office rainfall site and had the station code of 3677/1. The monthly rainfall records are held in the archives at the Met' Office (ref' Archive V01.A-V05.A) and were:
The actual completed returns form for the Met' Office are shown below
Obviously a shame that the record was not for longer to enable any meaningful comparisons, but I look at these and simply think that they were fairly averages years. However, whilst 1946-48 were probably average, both of 1945 and 1949 with the figures shown were looking like dry years!
The one month that does stick out is that of April 1947 with 9.37 inches (238 mm) of rain, which was the wettest recorded in this period and especially when April is on average a dry month.
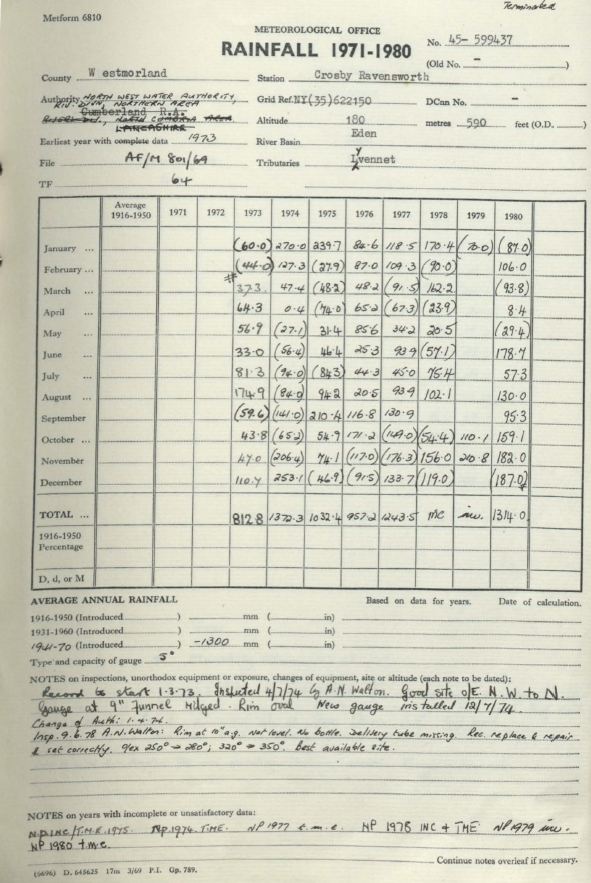
We then have to jump forward to the years 1973-80 when once again a rain gauge was back in the village - This was on behalf of the North West water authority and was an official Met' Office site, station number 45-599437, the records being held by the Met' Office archive (Ref: Archive V07.B1-V11.A5).
These show that the drought years of 1975-76 were not unusually dry and unfortunately the majority of 1979 shows no record at all and 1978 is missing September's record.
A grid reference is shown as NY(35) 622150 and height of 590ft asl, which would put the gauge somewhere behind the primary school. The records are now made in mm's and whilst the records state 'records to start 1.3.73.' figures are also given for Jan' and Feb' of that year. The details are:
The actual completed returns form for the Met' Office are shown below
This data whilst useful is, due to incompleteness, unsatisfactory and it does appear that from notes on the record that some monthly figures have an element of doubt against them.
However, a few of the months jump out at you: April 1974 with just 0.4 mm, that is just 0.01 inches, has 'drought' written all over it (this was also the driest month in the Orton series 1967-2012 at just 3.0 mm). But it came in the wettest year in the period and in the year that contained the two wettest months in that period. However, just 0.4 mm of rain in a month is exceptional.
The three successive months of Nov'/Dec' 1974 and Jan 1975 all recorded in excess of 200 mm, that is something quite out of the ordinary and the village must have resembled a swimming pool at the end.
As previously mentioned the drought years of 1975 and 1976 do not appear to have faired too badly. Alas I have no temperature records for the years and the rainfall amounts could easily have been concentrated on just a few days in the month, so the situation could have been worse than what appears on paper. But the figures clearly show the start and end (Feb' 1975 - Aug' 1976) of the recognised period of drought.
These figures also show the wet summer's of 1948 and 1980 and both were indeed very wet, but not as wet as the summers of 2007 and 2004. Alas, other than Morland below, I do not have figures for 1912 which remains the wettest summer nationally; beating 2012 into second place, although locally at Newton Rigg (Penrith) 1912 would only be the fourth wettest.
So that leaves 2012 as the wettest summer on record, at least in Cumbria and with 402.4 mm at my own site in Maulds Meaburn and with 100 mm+ recorded in all three months, summer 2012 as been quite awful.
Obviously there are all the records (rain from June 2007 and temperature from January 2009) from my own site (see rest of this website) for the village, but prior to that we had to go all the way back to 1733 to find something (see top of page) - and then at present I have two newspaper articles about weather events in the village.
The first is from 1839 and concerns an 'hurricane' visiting the village and then from 1947 which was one of the other occasions when the village flooded - first the newspaper article from 1839 (Cumbria Pacquet of 15th January) and then the account from 1947:
1947
The main harsh part of winter 1947 fell from the end of January through to the 10th of March when a sudden thaw left thousands of home flooded, mainly in the Midlands. However, this event in Maulds Meaburn was in the middle of January and followed a prolonged period of �incessant rain� on top of snow melt. There was much local flooding and the following article appeared in the Cumberland and Westmorland Herald:
�At Maulds Meaburn old residents said they had never seen conditions so bad, the village green was like a lake. At the corner near Meaburn Hall the road was under nearly two feet of water. Flooding near the school made it impossible for children to leave on foot and they were eventually conveyed on a tractor, which also proved a good friend to stranded motorists.
The bus leaving Crosby Ravensworth at 5 p.m. for Penrith could not follow its normal route via Cliburn, but had to travel via Appleby. Morland had its worst flood for 30 years. The river flooded and came up to the second step of the stairs in one house, whilst on the other side it was almost level with the step of Mr. Dent�s shop.�
2014 onwards
And that was where the record ended, until my own records commenced, but now since 2014 I have had a rain gauge located at Crosby Ravensworth School. My hope was that the children at the school would keep a record, but it quickly became apparent that this was not going to happen (hence the few missing months in the first year), so I took on the record myself.
The gauge is not read every day, but about 10 times during the month and always on the 1st so that an accurate monthly record is kept. It is located some 0.7 miles from my own gauge, obviously to my south, and gives an intriguing picture of how in such a short distance the rainfall can change and yes Crosby Ravensworth is wetter than Maulds Meaburn.
The monthly differences between the gauges at Crosby Ravensworth and Maulds Meaburn are still generally quite small.
During 2017 Maulds Meaburn was wetter in just the one month, April (and very marginally at that, just 0.2 mm more), but which follows the trends of the previous years in that Meaburn is wetter in the year's driest month and/or when the dominant winds were not from the SW. However, 2018 has been that little bit different with an increase to four months when Maulds Meaburn was the wetter of the two. Now into 2019 and only April was wetter in Maulds Meaburn.
The annual total of 1349.8 mm (53.14") at CR is 109.6% of that at MM and once again compares quite favourably to the previous four years (114.2% in 2015 - 110% in 2016 and 2017 - 107.5% in 2018).
2019 is the fourth year of there being a gauge at CastleHowe Scar (between CR and Shap) and the final total of 1652.4 mm is still showing a fine correlation to that at MM and CR as the amount of rainfall increases closer to Shap.
In those four years the percentage difference between Castlehowe Scar and Maulds Meaburn have been:
2016 = 115.3% 2017 = 132.0% 2018 = 132.7% 2019 = 134.2%.
And so the Crosby Ravensworth record comes to an end!
One day during July 2020 I arrived at the gauge to find that it was out of the ground. Why, when, who and how remain unkown, but I had always thought that at some point I should try a gauge to the north of myself in Maulds Meaburn - and thus I did not replace it.
Whilst always sad to end one record, whilst at Crosby Ravensworth, this gauge has served well and given us a good idea of the decrease in rainfall as we go north - which when then compared to all the other local gauges (Tebay, Orton and through to Kirkby Thore) creates a really useful comparison.
The gauge was back up and running from the 1st September in the north of the village in a field somewhere near Snowdrop Barn (thank you David) and where I expect it to record about 5% less per year than myself at the south end of the village - just think, that would see the north end of MM about 15% drier than the north end of CR (how much drier than the south end of CR?).
Below are the monthly totals for 'Maulds Meaburn North'
RANDOM YEARLY COMPARISONS
Taking a few random years from the rainfall guides and trying to use Maulds Meaburn/Crosby Ravensworth as a central point we find some interesting points:
1883 - Reagill recorded 48.25 inches of rain, other nearby figures are: Shap (Sleddale) 86.00" - Shap (Copy Hill) 65.27" - Appleby 37.49" - Orton 62.42" - Ravenstonedale 47.14"
1885 - Reagill recorded 38.89 inches of rain, other nearby figures are: Shap (Sleddale) 81.45" - Shap (Copy Hill) 57.23" - Appleby 25.28" - Orton 54.62" - Ravenstonedale 37.04"
1889 - Reagill recorded 30.06 inches of rain, other nearby figures are: Shap (Sleddale) 52.20" - Shap (Copy Hill) 39.55" - Appleby 27.71" - Orton 39.68" - Ravenstonedale 31.83"
1900 - Great Strickland recorded 36.97 inches of rain, with Morland having 33.45" - Lowther Castle 33.80" - Shap Vicarage 46.22" - Ravenstonedale 51.98" and Appleby 31.30"
1918 - Morland recorded 43.01" with Ravenstonedale (The Chantry) having 62.61" - Appleby 43.47".
1934 - Morland recorded 35.75" with Appleby having 35.42" - Shap (Thornship Gill) 66.84" - Cliburn 32.63" - Temple Sowerby (The Grange) 29.47" - Ravenstonedale (railway stn) 46.25"
1936 - Morland recorded 40.27" with Appleby having 37.09" - Shap (Thornship Gill) 62.78" - Temple Sowerby 33.37" - Ravenstonedale (railway stn) 45.31"
© Darren Rogers 2012-20
Want to comment on this site or do you have any information that you would like to see included on this page? Please contact - email
Crosby Ravensworth village lies some three miles east of Shap and five miles south-west of Appleby-in-Westmorland in the Eden valley. It is an idyllic setting in a very much undiscovered and unspoilt part of Cumbria. To leave the M6 motorway at junction 37 (Sedbergh) and have to navigate your way to Carlisle via the assorted villages in the Eden valley is a true delight, a must.
 RAINFALL AT CROSBY RAVENSWORTH 1869 - 1878
INCHES
MM's
RAIN DAYS
The Rev. Weston was still at Crosby Ravensworth when he died in 1887 and I can only assume that he ceased recording rainfall in 1878 as there are certainly no other entries after this year. The rainfall guide of 1879 reads: 'Crosby Ravensworth - No readings.' 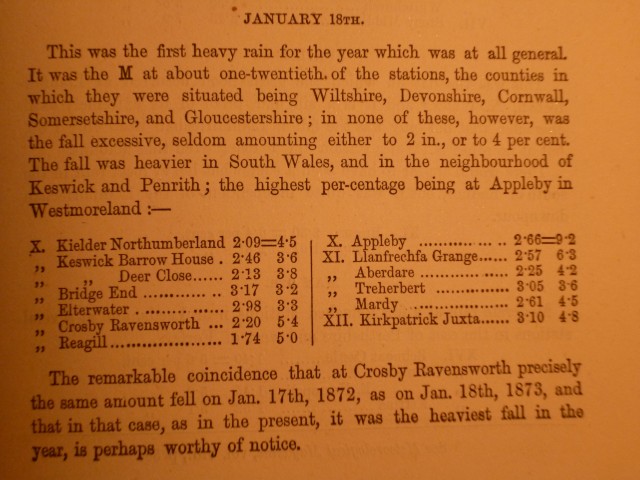
 RAINFALL AT REAGILL 1872 - 1889
INCHES
MM's
RAIN DAYS
As mentioned above, the record for 1880 is 'missing', but its calculation was made possible due to an entry made by Wilkinson in the school logbook.
		     Seathwaite        Reagill      Greta Bridge       Durham
1872
        JAN    1st	1.76		0.88		0.16		0.05
	       3rd	1.26		0.51		0.00		0.15
	       4th	1.41		0.80		1.00		0.25
	      10th	1.12		0.27		0.18		0.28
	      12th	1.18		0.33		0.00		0.10
	      13th	3.45		1.15		0.00		0.04
	      16th	2.89		0.50		0.00		0.10
	      17th	5.82		2.00		0.22		0.00
             *22nd	0.94		0.18		0.40		0.34
             *23rd	0.00		0.24		0.51		0.43
	      28th	1.40		0.06		0.00		0.01
	      29th	4.27		0.54		0.08		0.35


       FEB     1st	1.18		0.33		0.23		0.16
	       3rd	1.11		0.23		0.19		0.05
             * 4th	0.93		0.07		0.47		0.40
	      10th	1.15		0.30		0.05		0.00
	      17th	1.10		0.51		0.29		0.16
	      19th	1.44		0.47		0.00		0.01
	      23rd	1.77		0.48		0.18		0.27
	      24th	1.59		0.73		0.43		0.96
             *25th	0.00		0.06		0.28		0.39
	      28th	2.00		0.23		0.02		0.02
	      29th	1.42		0.13		0.06		0.08

       MAR    17th	1.98		0.33		0.01		0.12
             *20th	0.00		0.00		0.00	       {0.65
             *21st      0.00		0.00		0.00	       {
             *22nd	0.00		0.00		0.00		0.47
	      27th	1.13		0.75		 ?		0.39
	      28th	1.36		0.48		 ?		0.31
	      29th	1.85		0.55		 ?		0.29

       APR     7th	1.48		0.14		0.17		0.12
             *21st	0.00		0.06		0.95		1.53
             *27th	0.84		1.10		0.51		0.43

       MAY     3rd	2.39		0.43		0.00		0.13
	       4th	2.11		0.42		0.30		0.04
	       7th	1.50		0.35		0.10		0.67
             *11th	0.34		0.02		0.00		0.69
             *13th	0.02		0.00		0.29		0.35
	      29th	1.29		0.09		0.00		0.00

      JUNE   * 9th	0.98		0.25		0.66		0.39
	      10th	1.22		0.35		0.05		0.09
             *18th	0.00		0.24		0.66		0.32
	      19th	1.40		0.16		0.04		0.05
	      27th	1.67		0.23		0.00		0.08

      JULY     7th	1.30		0.19		0.97		0.11
             *12th	0.90		0.89		1.17		0.43
             *13th	0.02		0.03		0.44		0.73
             *26th	0.08		0.35		0.44		1.24

       AUG   * 5th	0.38		0.32		0.32		0.45
	      10th	1.59		1.13		1.05		0.92
	      12th	1.19		0.25		0.10		0.16
	      25th	1.13		1.12		0.30		0.38
	      28th	1.62		0.00		0.00		0.01
             *31st	0.00		0.01		0.00		0.40

      SEPT   * 1st	0.49		0.40		1.17		0.47
	       5th	1.25		0.03		0.00		0.00
	       9th	1.30		0.40		0.32		0.16
	      10th	1.46		0.10		0.02		0.01
	      11th	1.62		0.10		0.00		0.00
	      12th	1.21		0.01		0.00		0.03
	      13th	1.49		0.54		0.08		0.09
	      27th	2.06		1.16		0.33		0.30
             *28th	1.89		0.55		0.00		0.15
             *30th	2.34		0.26		0.10		0.10

       OCT     1st	2.05		1.10		0.00		0.21
	       6th	2.61		0.00		0.00		0.22
	       8th	1.53		0.43		0.24		0.40
	      10th	1.62		0.91		0.62		1.07
             *11th	0.28		0.20		0.11		0.43
             *16th	0.19		0.28		0.64		0.83
             *20th	0.41		0.35		0.00		0.60
             *21st	0.84		0.85		0.68		1.15
	      29th	5.00		2.00		0.41		0.15


       NOV     1st	1.37		0.42		0.46		0.41
	       4th	2.34		0.35		0.04		0.00
	       5th	3.40		0.36		0.00		0.25
             *11th	0.00		0.04		0.25		0.56
             *15th	0.00		0.04		0.83		1.60
	      19th	1.17		0.55		0.21		0.25
	      20th	1.26		0.17		0.00		0.00
	      22nd	1.11		0.46		0.83		0.63
	      23rd	1.78		0.91		0.19		0.20
	      25th	1.29		0.71		0.53		0.34
             *29th	0.45		0.30		0.33		0.43

       DEC     5th	2.06		0.56		0.37		0.14
	       8th	2.08		0.52		0.60		1.08
	       9th	1.40		0.00		0.00		0.00
             *10th	0.00		0.00		0.00		0.40
	      16th	2.48		0.00		0.00		1.82
             *17th	0.33		0.16		0.00		0.79
	      22nd	1.11		0.30		0.43		0.22
	      23rd	2.11		0.70		0.00		0.04
	      24th	1.15		0.26		0.02		0.05
	      27th	2.70		0.81		0.00		0.05
             *28th	0.68		0.83		0.41		0.36


1873
       JAN     1st	1.40		0.40		0.14		0.08
	       4th	1.03		0.44		0.00		0.18
	       5th	2.48		1.04		0.64		0.17
	       8th	1.92		0.76		0.19		0.19
	       9th	2.18		0.75		0.10		0.05
	      10th	1.65		0.93		0.01		0.00
	      12th	2.75		0.40		0.18		0.00
	      13th	3.85		0.22		0.04		0.00
	      14th	1.10		0.41		0.00		0.00
	      18th	3.20		1.74		0.00		0.35
	      26th	1.59		0.30		0.07		0.21

       FEB    25th	1.61		0.46		0.00		0.31
	      26th	1.20		0.00		0.67		0.26

       MAR     6th	3.52		1.05		0.90		0.51

      SEPT    30th	4.00		0.17		0.02		0.32

       OCT     1st	1.10		0.00		0.83		0.47
	       2nd	2.00		0.43		0.29		0.74
	       6th	2.50		0.46		0.06		0.00
	       9th	4.20		0.15		0.12		0.04
	      21st	2.23		0.30	        0.15 ?		0.02
	      30th	1.10		0.03		0.04		0.07
	      31st	2.10		0.65		0.43		0.17

       NOV    21st	1.73		0.01		0.03		0.03
	      25th	1.25		0.14		0.07		0.08
	      26th	2.17		0.52		0.14		0.05
	      28th	1.48		0.11		0.06		0.00
	      29th	1.06		0.37		0.39		0.05

       DEC     1st	1.72		0.01		0.01		0.00
	      15th	1.56		0.22		0.08		0.00
	      30th	1.80		1.03		0.36		0.13
And so ends the report, maybe Seathwaite can have an inch of Scotch Mist on one of those typical claggy and damp mountain days when over in the Eden valley we are virtually dry and maybe evn have a little sunshine!
CROSBY RAVENSWORTH
1945
1946
1947
1948
1949
1973
1974
1975
1976
1977
1978
1979
1980
 MAULDS MEABURN
		 Jan	 Feb	 Mar	 Apr	 May	June	July	 Aug	Sept	 Oct	 Nov	 Dec		Year

2014									171.8	  -	  -	 85.0	112.0
2015		227.9	 84.9	121.6	 53.4	125.2	 35.4	 87.0	102.5	 30.3	 76.7	279.9	676.0		1900.8
2016		234.1	132.6	 75.9	102.3	 28.6	 89.6	 68.3	141.5	113.9	 26.6	 84.7	 85.8		1183.9
2017		 63.7	 95.4	111.2	 19.4	 43.6	162.9	112.3	 73.6	148.5	135.4	118.3	123.8		1208.1
2018		153.4	 92.3	 66.1	 62.5	 38.7	 92.3	 46.3	 69.5	134.8	143.0	147.6	111.8		1158.3
2019		 43.9	108.9	210.2	 49.6	 24.5	114.6	123.6	176.2	130.3	115.0	103.4	149.6		1349.8

2020		168.4	428.6	117.4	 16.5	 25.0	153.3

Mean		148.6	157.1	117.1	 50.6	 47.6	108.0	 87.5	122.5	111.6	 99.3	136.5	209.8		1398.5
		 Jan	 Feb	 Mar	 Apr	 May	June	July	 Aug	 Sept	 Oct	 Nov	 Dec		 Year

2020										 65.0	163.7	131.1	164.1
2021		127.1	177.8	156.8	 13.7	131.9	 17.7	 59.4	 41.7	 55.0	205.8	 52.2	 90.4		1129.5
2022		 61.6	176.8	 42.0	 44.1	 66.9	 83.3	 66.5	 21.1	106.2	211.4	175.7	142.1		1197.7
2023